E-29, E Block, Budh Vihar,
Noida, Uttar Pradesh
201301
Charts Library in React Js
10th,Feb 2022
Overview
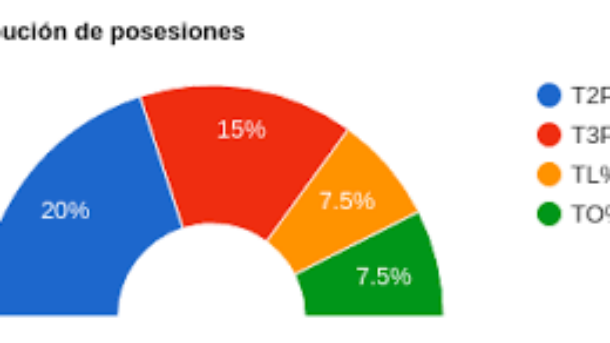
React Chart component is a versatile data visualization tool that can be used in a variety of apps. This single component comprises a large variety of models and many sorts of charts, all with built-in support for tooltips, zooming, and panning. It’s completely self-contained, with no reliance on third party libraries. Each chart can be rendered as an SVG or a Canvas element, depending on a single property, and exported to a variety of formats such as an image or PDF.
List of Charts in React js
Chart component has a long list of available chart and series types –
- Area Chart
- Bar Chart
- Bubble Chart
- Bullet Chart
- Line Chart
- Pie Chart
- Polar Chart
- Stock Chart
- Waterfall Chart
Data Types Binding
The data used in the chart might range from a simple array with X and Y values to more complicated data types and objects with fields.
Chart Animations
Small modifications like using the highest values or having bars animate in one at a time can make any chart pop—and be visually pleasant to end users. The built-in animations in React Charts are enabled by default, however every animation can be fully controlled and switched on or off at a granular level.
Top React Chart Libraries
It can be difficult to create user-friendly, responsive charts. However, if you have the right tools, you can make it a lot easier. So, in this article, I’ll go over the top five chart libraries for React, along with feature comparisons to help you decide which one is best for your next project.
1. Recharts
Recharts offer the advantage of generating attractive charts right away. The negative is that if you don’t like the chart styles it offers, it’s difficult to customize.
2. React-chartjs-2
If you’ve used Chart.js with React, you shouldn’t have any trouble picking up this library. React wrapper for the popular JavaScript Chart.js package, react-chartjs-2. Many Chart.js functionalities are available in react-chartjs-2. Animation is supported by react-chartjs-2, and most of the charts it provides are responsive by default. The library includes pre-built components for a variety of chart styles and also enables for customisation. Although react-chartjs-2 does not have its own documentation, its website demonstrates the various chart kinds and how to use them. Chart.js also comes with comprehensive, easy-to-understand documentation.
3. Victory
Victory is “an opinionated, but fully overridable, ecosystem of composable React components for constructing dynamic data visualizations,” according to the official documentation.
Victory, like many of the other React chart libraries on this list, was created using React and D3. It comes with a large number of fully configurable charts right out of the box.
Victory comes with extensive, clear documentation, making it user-friendly and simple to get started with. It has SVG drawing support as well as customizable high-quality animations (at least to some extent). Victory also has adaptable charts that adjust to different screen widths.
Victory has a number of advantages, including the ability to create iOS and Android applications. This is because Victory has a React Native version that uses an API that is nearly identical to the web version.
4. Nivo
Nivo, like many other React chart libraries, was created with React and D3 and offers a wide range of chart styles and designs. The library includes HTML, Canvas, and SVG charts, as well as client and server-side rendering and animation capabilities.
It includes a large number of attractive charts that can be easily altered if necessary. Many of the charts it offers are responsive by default, meaning they adapt to different screen widths. Nivo also supports React Motion-powered motion and transitions.
It has a lively community and active maintainers, as well as a gorgeous website with comprehensive documentation that makes getting started simple. Nivo may be set up with either npm or yarn.
5. React- Vis
React-Vis is one of the simplest React charting libraries to get started with. It was created by Uber and is developed with React and D3.
If you’ve ever worked with React components, you’ll find it easy to work with react-vis components because they work in the same way, with props, children, and callbacks. You may make a variety of charts with React-Vis, including line, bar, and pie charts, among others. It comes with some nice, customisable charts and supports animated charts powered by React Motion out of the box. Drawing functionality for Canvas and SVG is also included in React-Vis
To utilize React-Vis, you don’t require extensive expertise of any data visualization package; the simple documentation will get you started.
Conclusion
There are far too many charting libraries for React to cover in a single article, but the five libraries listed above are among the most popular and well-liked in the community. Recharts, react-chartjs-2, Victory, Nivo, and React-Vis are all popular libraries that have a track record of assisting React developers in creating useful and appealing charts.
When choosing a chart library for your React project, keep in mind that they were all developed to assist developers in achieving a certain goal. Examine their features and functions before picking which is appropriate for your project. Some chart libraries are better suited to smaller projects, whereas others are better suited to larger ones.
In the end, the React chart library you select will be determined by your project requirements and the types of features you prefer to use.


